Description:
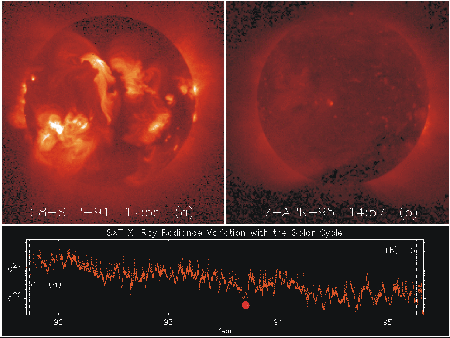
Picture on the left shows the corona with the usual code of intensities of red, yellow and white. The Sun in minimum is shown on the right with only one (red) X-ray bright point. It is fully covered by coronal hole (black). Curve below describes the intensity of the X-ray emission. The intensity clearly decreased by 10 times between the start of 1992 (see “92”) and 1993 Aug. (see red point). The wind-brake-effect of the weaker and weaker corona was diminished continually. This caused an acceleration of the “slow wind” to a “fast wind” (see straight line of interpolation with “Slow” in 4.69). Later the X-ray intensity was stronger again up to 1994 March. These positive charges pulled again the windmasses which can be also seen at least by four dips (see them with “+”) in the velocity curve 4.69. (Internet Yohkoh ISAS)
Source:
Yokoh Homepage


