Sun with cold sunspots heat troposphere stronger
published: IUGG Birmingham 1999During centuries, the Sun was believed to heat stably. In about 1985 it became clear that the Sun heats slightly instably but this instability was believed to have no influence on the Earth. The present new evaluation of a very recent measurement suggests that also these small variations of the solar irradiation are not overbalanced by the turbulent terrestrial climate.
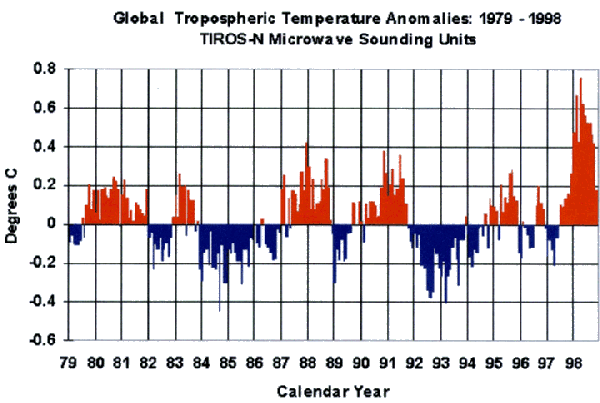
In 1999 Jan.12, at the 10th Symposium on Global Change Studies, three scientist reported a new measurement *. They showed the values of the global microwave radiation of the troposphere of the last two decades. The temperature of oxygen up to an altitude of 8 km determines this radiation and, therefore, the temperature of the air can be shown (Fig. 1).Some of their results are:
1 The authors corrected and averaged the delivered data of the instruments Microwave Sounding Unit (MSU) aboard the 9 TIROS-N weather satellites to develop the red and blue curves in Fig. 1 . They compared their results with other temperature measurements.
2 The global warming cannot be found. An exception is the year 1998 which was the hottest year in this century.
3 The three authors believe that vulcanoes gave the main modifications of the temperature curve. They mentioned El Chichon in 1982 Marc and Mt.Pinatubo in 1991 Jun.
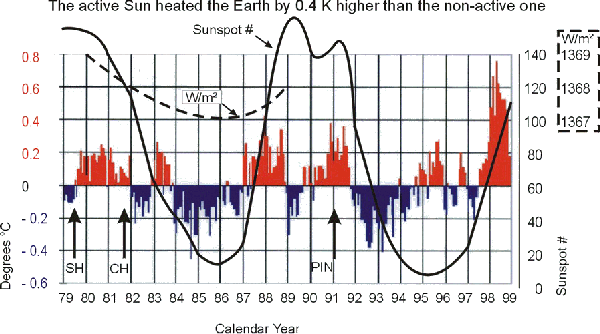
Surely, the ashes of volcanoes screen the solar radiation but not for three years (e.g. in 1984-1987 in Fig.1). Additionally, one can find no clear coincidences between the eruption of a volcano and the lower or higher temperatures if we exactly record the eruptions (arrows with CH and PIN in Fig. 2.) . For example, Pinatubo (PIN) erupted and the temperature became lower only one year later. Additionally, we can take the strong eruption of Saint Helen (SH) in 1980 January into account, but the temperature did not became lower during the following two years.
Very probably, however, the microwave radiation in Fig. 1 does not show anomalies but the regular temperature variations caused by the pulsating solar irradiation during the solar cycle. The thick line in Fig. 2 is the sunspot-curve (Cugnon 1999). The higher (red) temperatures follow roughly the sunspot-maximums and the blue ones the minimums. During the years of the cold sunspots, the Sun heated the Earth by 0.4 K higher, related to the spotless Sun. (Possible explanation see: Körtvélyessy 1998).
High above the troposphere and far away from all disturbances, the instrument Active Cavity Radiometer Irradiance Monitor (ACRIM) aboard the satellite Solar Maximum Mission measured the solar irradiation with a tolerance of 0.01% in 1980-1989 (dotted line, Phillips 1992). From 1369 W/m² in 1980 ( in maximum), the irradiance curve follows the sunspot-curve (thick line). The irradiance was minimum (1367 W/m²) when the Sun was almost spotless in 1986. The global terrestrial temperature was lower by 0.2 K in 1986 related to the average value of these two decades. A repetition with similar values followed in 1986-1996.
Probalby, this is the first function of solar irradiance versus global temperature of the Earth.
* download at: http:/science.nasa.gov/newhome/headlines/essd12jan99_1.htm
The scientists are J.Christy, R.Spencer, W.D.Braswell
P.Cugnon 1999 Jan. http://www.oma.be/KSB-ORB/SIDC/DATA/yearssn.dat
H.C.Wilson and H.S. Hudson (shown in 1992 by K.J.H.Phillips Guide to the Sun, Cambr.Uni.)
L.Körtvélyessy: The Electric Universe (EFO Budapest 1998) 704 p.

